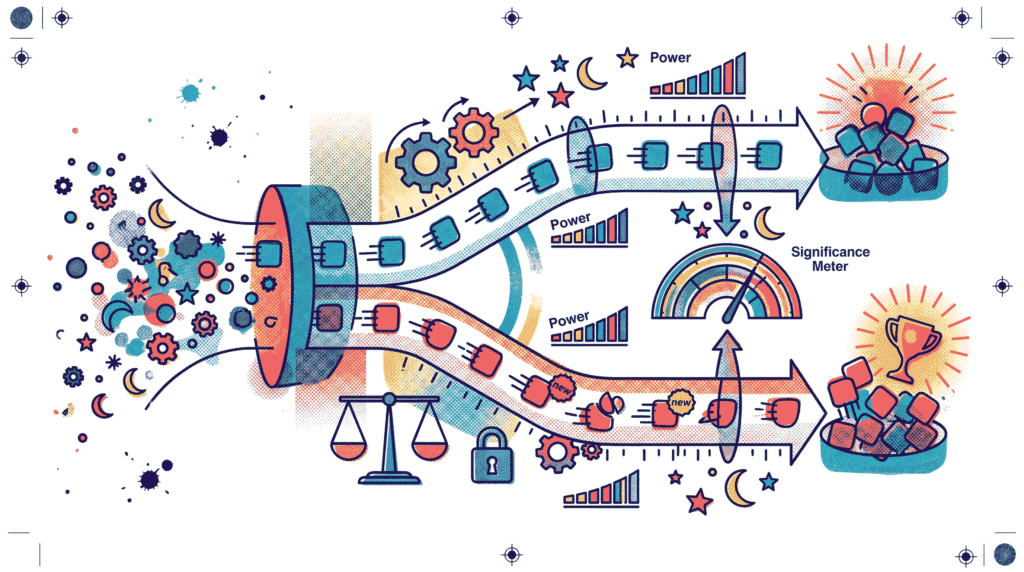
A/B testing best practices boil down to a totally simple concept: you put two different versions of a webpage head-to-head, track the actual numbers, and force the data to make the call instead of relying on the gut feeling of the highest-paid guy in the room. Guessing loses money. You run the numbers through strict hypothesis testing to figure out if your brilliant redesign actually drives sales or just looks pretty on a monitor. We lay out the exact steps right here so you can figure out how these experiments actually work, why they blow up in your face, and how to set them up without lying to yourself.
What this article covers
- What hypothesis testing actually does in the real world.
- Building an experiment that doesn’t lie to you.
- Dodging the absolute worst rookie mistakes.
Why it matters
- It kills ego-driven design choices.
- It proves if a feature actually makes money.
- It stops you from pushing broken code to production.
What Is Hypothesis Testing in A/B Testing Best Practices?
Hypothesis testing forces you to prove that the spike in your conversion rate is actually real instead of just a totally random statistical fluke caused by a handful of weird users logging in at the exact same time. The math demands evidence. You set up the test, pick a solid metric, and drag the results through the mud to see if they hold up to basic scrutiny.
Look at the two sides of the coin. The null hypothesis basically states that your shiny new button color did absolutely nothing to improve sales. The alternative hypothesis claims your change actually moved the needle and made the company money. Your job isn’t to force the data to fit your boss’s opinion-your job is to scrape up enough hard evidence to reject the idea that nothing happened. Prove it.
- Null hypothesis (H0): Your update did absolutely nothing.
- Alternative hypothesis (H1): Your update actually worked.
- Test statistic: The raw math summarizing the whole run.
- p-value: The exact odds that your result is just pure dumb luck.
You read the p-values, Type I error, and Type II error breakdown to stop yourself from making totally embarrassing rookie mistakes when interpreting the data. It keeps the math grounded.
Why A/B Testing Best Practices Matter
Anybody can spin up a quick split test in five minutes, but building an experiment that actually tells the truth is a completely different story. A badly built experiment will actively lie to your face-handing you a fake win that ends up tanking your quarterly revenue the second you push it to the live servers. You lean on A/B testing best practices to stop yourself from shooting yourself in the foot with biased samples, horribly short run times, and pure statistical noise. Protect the data.
Teams that respect the math learn ten times faster. You stop arguing about which headline sounds better and just let the actual users vote with their wallets. A tiny tweak to a checkout page can pull in an extra hundred grand a month-but only if you didn’t botch the test setup on day one.
| Part of the test | What it means | Why it matters |
|---|---|---|
| Hypothesis | The actual claim you want to prove. | Stops you from testing random garbage. |
| Metric | The exact number you care about. | Kills the emotional arguments. |
| Randomization | Tossing users into buckets blindly. | Stops the groups from stacking unevenly. |
| Decision rule | The hard cutoff for winning. | Keeps you from moving the goalposts. |
A/B Testing Best Practices: Start With a Clear Question
You have to lock down the exact question before you touch the testing software. You want to know if cutting three form fields out of the signup page actually drives more users to hit the submit button-because a sloppy goal guarantees a completely useless test that just wastes server time. Be specific.
A real hypothesis maps out exactly what you changed, why you bothered changing it, and the exact metric you expect to spike as a result of your work. Think about it like this: “Killing the middle three input fields will bump total signups by five percent because people hate typing on their phones.” You can actually test that sentence.
- Stop testing vague ideas.
- Pick one single number to judge the winner.
- Write the exact expected outcome down before you start.
- Make sure a five-year-old can understand the goal.
Setting a hard target stops the marketing team from shopping around for a totally unrelated metric to justify a failing test. You call the shot before the timer starts.
Choose the Right Metric First
The numbers dictate the winner. If you track the wrong variable, your test might show a massive win on paper while actively burning the company’s money in the real world. Slapping a giant red banner on the homepage might double your click-through rate, but if those users instantly bounce and refuse to buy anything, you just ran a totally successful test that destroyed your sales. Track the money.
Smart teams lock in one primary metric and a handful of guardrails. The primary number is the absolute goal of the entire operation, while the guardrails exist purely to ensure your shiny new feature doesn’t accidentally break the rest of the website while it chases that goal. If you test a faster checkout flow, the primary goal is total completed orders-but your guardrails track server errors and customer service complaints to make sure the speed didn’t break the credit card processor.
- Primary metric: The one number that actually matters.
- Guardrail metric: The safety net to stop catastrophic failures.
- Leading metric: The early warning sign of a win.
- Lagging metric: The final cash deposit at the end of the month.
Stop tracking twenty different numbers at the exact same time. Tossing a massive dashboard of random stats at an executive just creates absolute chaos and gives everyone an excuse to argue about the results. Keep it to one target.
Sample Size, Power, and Duration
People get impatient and kill their tests way too early. A tiny test group will always throw a massive, totally fake spike on day two that completely vanishes by day five, forcing you to roll out a totally broken feature. Math takes time.
Power is just the actual mathematical odds that your test will catch a real winner instead of missing it entirely. If you want a high-powered test that actually spots the truth, you have to feed it a massive number of users to crush the statistical noise. You trade time for confidence.
- Sample size: The total headcount of users trapped in the experiment.
- Power: The odds of actually catching a real win.
- Significance level: The hard line where you call out a fake result.
- Minimum detectable effect (MDE): The absolute smallest bump in sales you actually care about.
You cannot just run a test for three days over a long weekend and pretend the data holds up. You have to let the traffic flow through an entire normal business cycle to average out the weird Tuesday spikes and the Sunday slumps. Waiting another week to close the test is infinitely better than pushing a broken layout to a million users.
Read the breakdown on the Central Limit Theorem if you want to understand why grabbing a larger sample size instantly forces the wild data swings to calm down and stabilize into something readable.
Practical rules for duration
- Stop pausing the test just because the graph looks awesome on day two.
- Don’t panic and kill it when the numbers dip slightly.
- Hold the line until you hit the exact user count you planned for.
- Make sure a full week actually passed.
Randomization and Segmentation in A/B Testing Best Practices
You have to sort the users blindly. If you accidentally dump all the mobile users into group A and all the desktop users into group B, your entire test is a complete joke from the very first second. The script has to toss people into buckets by pure chance to balance out the weird variables you can’t even see. Sort them blind.
Chopping the data up into tiny segments is a great way to find hidden insights, but it is also an incredibly easy way to lie to yourself. If you slice the traffic into fifty different micro-categories, statistical noise guarantees that at least one of those tiny groups will show a massive fake win.
- Blindly toss users into buckets.
- Stop letting people hop between version A and version B.
- Keep the groups totally separated.
- Use the data slices to ask new questions, not to fake a victory.
This is exactly where Simpson’s Paradox ruins your day. A test can look like a total failure overall, but magically look like a massive win if you only stare at the data for left-handed users on Android phones. Dig into the segments carefully.
Understand p-Values Without Overcomplicating Them
The p-value completely breaks people’s brains, but the actual concept is painfully simple. It literally just tells you how weird your final result would look if the update you made actually did absolutely nothing at all. A tiny p-value means the giant spike in clicks you just saw is incredibly suspicious if the button color change was truly meaningless. It spots the weirdness.
But here’s the catch-the p-value does not tell you if the change actually made you a ton of money. You can hit total statistical significance on a button change that increases conversions by a microscopic fraction of a percent. That tiny bump might be mathematically real, but it sure as hell doesn’t cover the engineering cost it took to build the feature.
You read the p-values and statistical errors guide to stop yourself from making totally embarrassing rookie mistakes in front of the data team. It keeps the math grounded.
A/B Testing Best Practices for Analysis and Decision-Making
The second the timer hits zero, you follow the rules you wrote down on day one. People love to stare at a failing test and mentally contort the numbers until it looks like a win-so you kill that bias by sticking to the original plan. Check the user count, verify the run time, and see if the primary metric actually hit the target. Follow the script.
Stop looking at a single hard number and start looking at the confidence intervals. The interval throws a wide net around the actual reality of the situation, showing you the absolute best and worst case scenarios for your new feature. If the net is ridiculously wide, your test proves absolutely nothing. If the net is incredibly tight and sits way above the zero line, you have a certified winner on your hands.
- Did you actually hit the headcount you promised?
- Did the main metric actually move?
- Check the confidence nets to see how wide the guess is.
- Figure out if the win actually pays for the engineering time.
Tell the truth. If the test completely flatlines, you stand up in the meeting and tell the boss it flatlined-and if the new checkout flow spikes revenue but absolutely destroys the customer retention rate, you show both charts. You run these experiments to dig up the actual truth, not to pad your resume with fake wins.
Tools That Support A/B Testing Best Practices
Nobody writes these testing scripts from scratch anymore. The industry runs on massive third-party platforms that automatically sort the traffic, track the clicks, and spit out the final math without you having to touch a single line of backend code. You wire up Optimizely, VWO, or Google Analytics and let their servers handle the heavy lifting. Buy the software.
The software handles the grunt work, but you still have to supply the actual brain power to make sure the test isn’t totally flawed. You tie the raw front-end click data directly into your massive backend data warehouses so you can actually prove the test made the company money.
- Experiment platforms: the bouncers that sort the traffic.
- Analytics tools: the trackers watching the clicks.
- Dashboards: the pretty charts for the executives.
- Event tracking: the raw logs of every single mouse movement.
Common Mistakes to Avoid
Smart engineers blow these tests up constantly. The good news is that you can dodge almost every single disaster just by locking down the rules on day one and refusing to touch the settings while the test is live. Keep your hands off it.
- Killing it early: the early spikes are totally fake.
- Swapping the target: moving the goalposts is lying.
- Running fifty tests: you cannibalize your own web traffic.
- Ignoring the calendar: the weekend buyers act totally different.
- Hyping micro-wins: a 0.01% bump is completely useless.
Staring at the live dashboard every five minutes is a fatal error. The second you see a random Tuesday morning spike and hit the stop button, you just locked in a totally fake win that will absolutely vanish by Thursday. You set a hard end date and you walk away until the timer goes off.
A Simple Workflow for Hypothesis Testing in A/B Testing
You need a rigid checklist to stop the chaos. Forcing your team to follow a strict order of operations completely kills the urge to launch sloppy, half-baked ideas directly to the live server. Stick to the process.
- Find the actual problem hurting the business.
- Write a hard, testable bet.
- Lock in the one number that matters and set the safety nets.
- Calculate the exact traffic count you need to survive.
- Sort the users totally blind.
- Fire the test off and refuse to touch it.
- Grade the final numbers without making excuses.
- Write the results down so you don’t make the same stupid mistake next year.
You force the team to run this exact same playbook every single week. You eventually stop guessing what the users want and start building a massive library of hard facts that dictate the entire product roadmap. That is the actual power of running these tests.
A/B Testing Best Practices Checklist
- Keep the bet totally clear.
- Live and die by one specific number.
- Lock the headcount in early.
- Let the clock run out.
- Sort the traffic blindly.
- Keep your hands off the live test.
- Do not treat the p-value like magic.
- Look at the wide confidence nets.
- Watch out for the segment traps.
- Write down the failures.
This checklist is simple, but it is powerful. If you follow it consistently, your tests will become easier to trust. More importantly, your decisions will become easier to defend. That is the real goal.
Conclusion
Hypothesis testing forces you to strip the emotion out of the room. You stop throwing random features at the wall to see what sticks, and you start running calculated, clinical trials to prove exactly what drives the revenue. The rules are painfully basic: ask a hard question, pick a ruthless metric, sort the users blind, wait out the clock, and tell the truth at the end. The math handles the rest.
You will run tests that completely flatline, and that is totally fine. Every single failed test stops you from pushing garbage code to the live servers and breaking the product. You stack those lessons up over time to build a totally bulletproof product strategy based purely on undeniable evidence.
Read the guides on Bayesian vs Frequentist Statistics, Understanding p-values, and Simpson’s Paradox to stop yourself from falling into the basic statistical traps that ruin most corporate experiments.
Further reading: You can also review the practical experimentation guidance at Optimizely, the analytics resources at Google Analytics Help, and statistical references from NIST.